Some interesting charts that should be considered and debated as Montgomery County pushes for approval of a larger budget, with more spending (and taxing).
Labor Force
This data is published monthly and is a representation of all persons in the civilian noninstitutional population ages 16 and older classified as either employed or unemployed. The civilian noninstitutional population are not inmates of institutions (e.g., penal and mental facilities, homes for the aged), and who are not on active duty in the Armed Forces.
As you can see, from 1991 to 2010, Montgomery County enjoyed 2 decades of increasing labor force. This trend corresponded to the trend of hiring and employment in the federal government.
In 2010 and continuing t0 2017, Montgomery County’s labor force entered a basing period. During this period of time the labor force pretty much stayed level in the county. This pattern is reflected also in the Employee Government chart, where there was a slow decline and a gradual rebound. Montgomery County then experienced a few years of an increase, breaking out of its base. This was driven not only by a corresponding growth in government employment, but if you remember, this period of time was “good”. People felt flush with cash nationwide. Stock market was accelerating. Wealth was being created and spent. Then. The pandemic hit.
You can see that in 2020, Montgomery County Labor force had a massive drop. There is not a labor force across the country that does not have a similar chart. The issue becomes evident when you look more closely at what has happened since. From 2020 to current Montgomery County has entered what appears to be another basing pattern. We have settled to around the same level seen from 2010-2017. What is more concerning though is that this pattern is not replicated in the government employee chart. While government employment experienced a similar drop, it has since steadily been recovering, and will probably reach pre-covid levels over the next quarter or two. Why has this happened? The most likely explanation is that Montgomery County’s labor base is no longer required to live in Montgomery County and as a result CHOOSES to live somewhere else. Federal employees are no longer tied to the DMV area, and if they are, they are not tied to live in close proximity to a federal office. Remote work has enabled the federal employee to seek out an environment they want to live in, while still being able to maintain their federal employment. This spells massive trouble for Montgomery County, who has not had to seriously consider the quality of life it offers residents for over 3 decades.
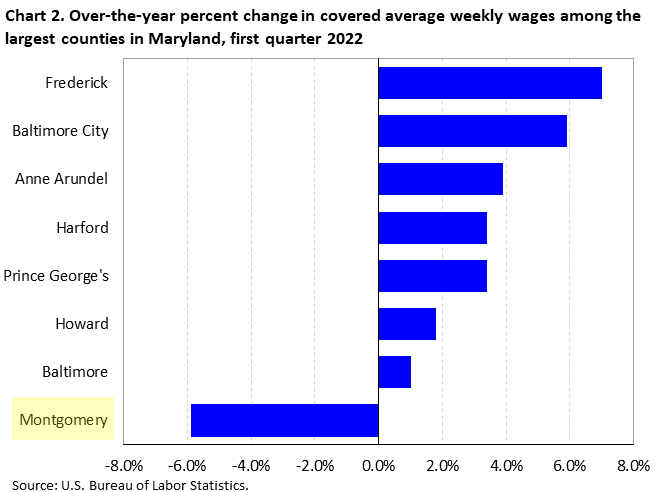
And for some of the 2022 data that is available, Montgomery County’s “recovery” is not comparable to other surrounding counties.
Population
Population estimates are updated annually using current data on births, deaths, and migration to calculate population change since the most recent decennial census. The data published seems to experience at least a 1 year lag. The chart below was published in March of 2022 and represents data to 2021. Hopefully 2022 data is published soon.
This is fascinating. Until the year 2021, it had been 40 years since Montgomery County had experienced a decline in population. From 79-80 there was a dip in population, but otherwise all data for Montgomery County shows a year over year increase. Until 2020-2021. Could this be the result of COVID deaths? Maybe. But it could also be the start of a more serious migration of the resident population out of Montgomery County. The net county-to-county migration trend in Montgomery County has not been positive since 2010.
In short, Montgomery County is approaching its next fiscal year budget as if its 2010. It is not. Things have fundamentally changed. It is time for our approach to spending, our prioritizations, our taxing to also fundamentally change. Continuing the trajectory sets us up for even greater pain.


