
With budget discussions well underway, the hot topic is additional funding for Montgomery County Public Schools. Sparked by a controversial proposal to raise property taxes by 10% to provide the additional funding, the unions and union backed politicians are out in full force advocating for it being a necessity.
Their argument is that MCPS is underfunded, and as a result our teachers and children are suffering. Supporters of the increase have gone into full activist mode, the latest example being interrupting a teacher appreciation ceremony to deliver a petition with 10,000 signatures supporting the property tax increase and additional funding.
Pres. @JMartinMCEA & members disrupt teacher appreciation ceremony to deliver 10,000+ signatures on a petition demanding @MoCoCouncilMD fully fund the @MCPS budget.
Sign our petition! https://t.co/uaNSOzlz9t#WeLoveOurPublicSchools #United4OurKids https://t.co/WvAIJCn1tt
— Montgomery County Education Association (@mceanea) May 9, 2023
What has largely been left out of this conversation, probably because it would cause voters to question not only the overall budget but also any increases, is: 1) a historic look MCPS’s operating budget and 2) the performance of MCPS schools.
We took the time to look at historic data from 1985 related to MCPS’s budget. Mind you, 1985 was a very different period of time. The population of the county was around 610,000 residents or 61% smaller than it is today. That being said, the data provides an excellent insight into the trend of funding for MCPS.
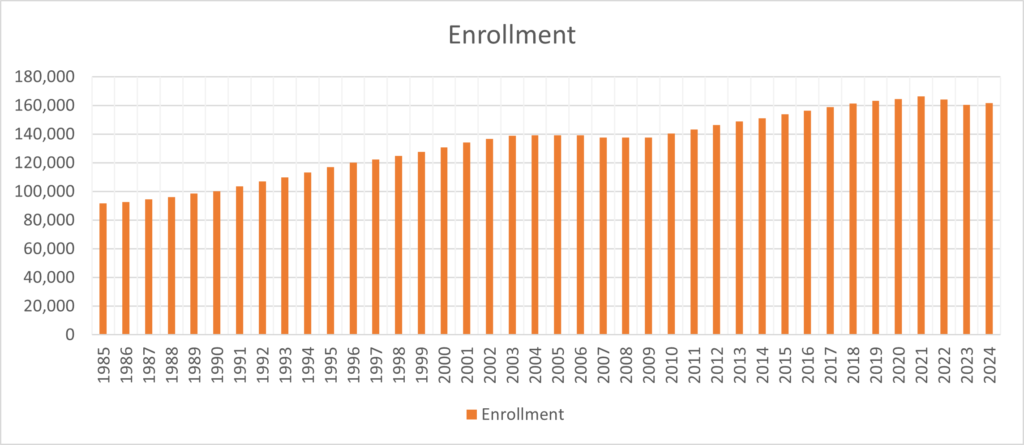
First a look at enrollment in MCPS. You can see that it has increased with the growth of the county, experiencing a slight drop starting in 2006 for 3 years, and has recently experienced another drop starting in 2021. The drop starting in 2021 is clearly related to the county and school system’s response to COVID-19 and will be interesting to see how permanent it might be.
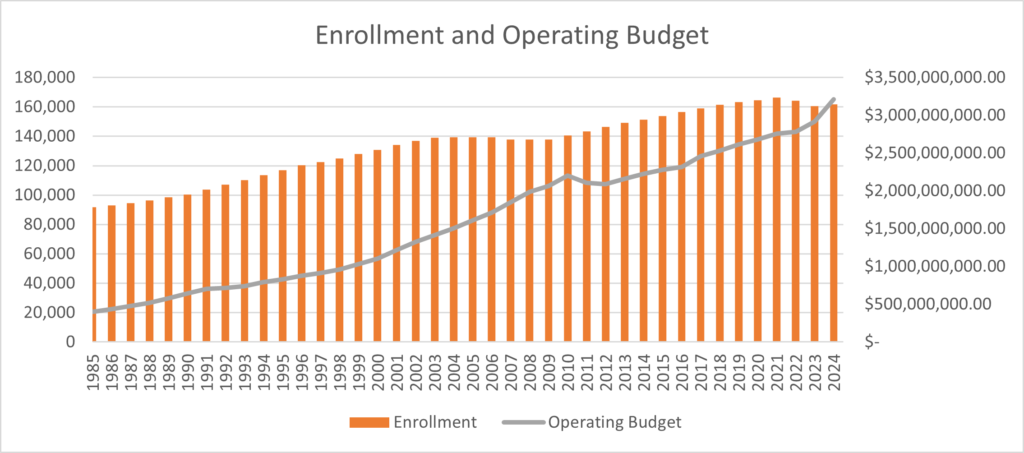
If you overlay enrollment with the operating budget of MCPS you get this view. You will see that historically the operating budget stays well below the enrollment number, until you reach the proposed 2024 budget.
So how has the operating budget for MCPS changed year over year from 1985. The following provides a year over year change in dollars as well as percent.
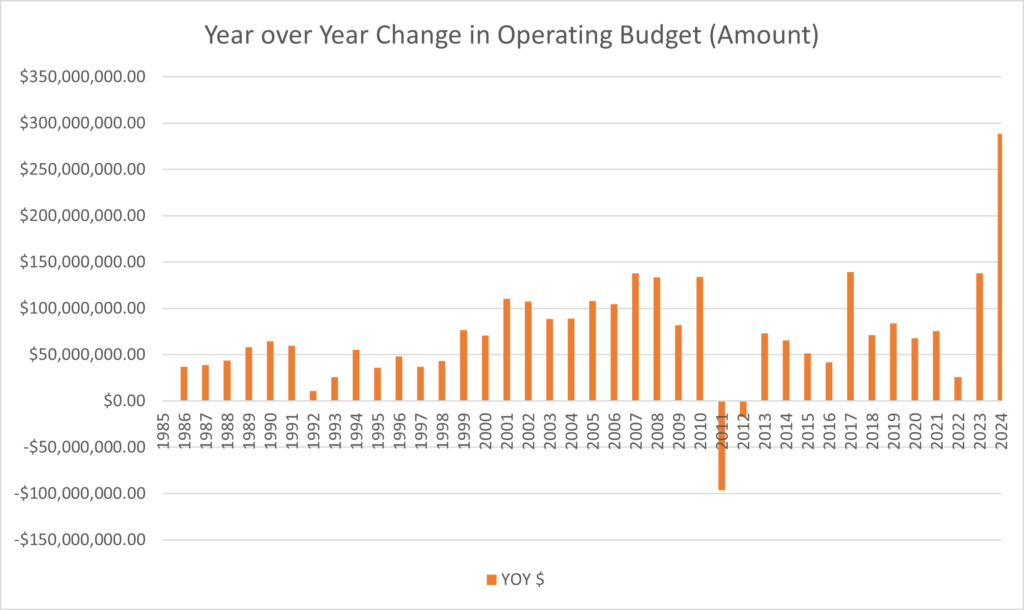
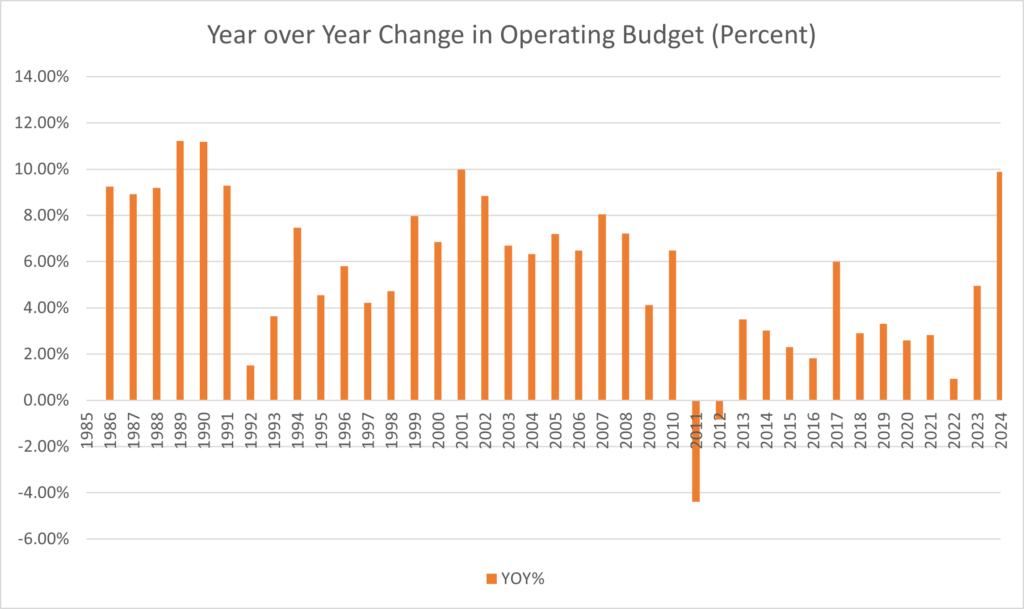
You can note that in 39 years there has not been a larger dollar increase in the MCPS operating budget than what it being proposed for 2024. Not since 2001 has there been a higher percent increase year over year.
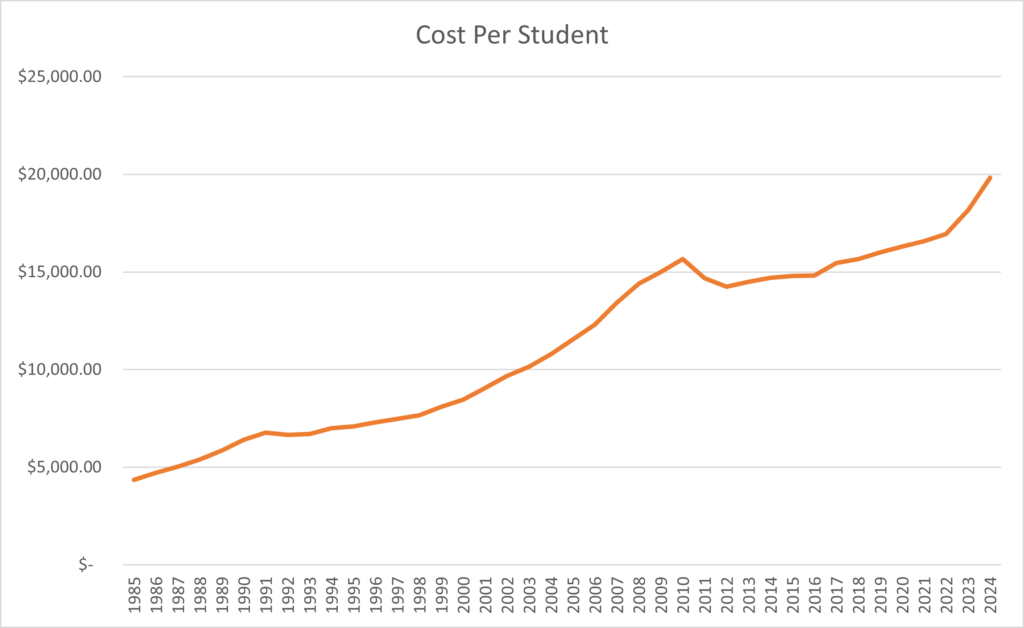
When you distribute the operating budget over the enrollment numbers you receive a cost per student.
I know. I can hear the screaming at the computer screen too. “WHAT ABOUT INFLATION?” Well luckily we have that information as well. Here is the cost per student adjusted for inflation for each year to today’s dollars.
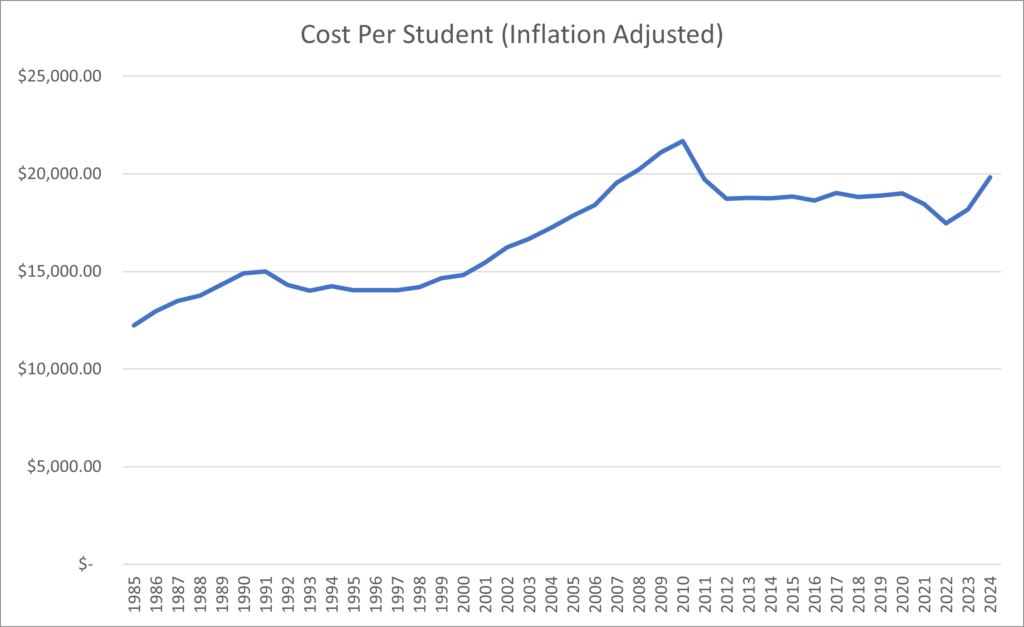
In 1985 we were paying a little over $12,000 per student in today’s dollars to educate a child. This amount skyrocketed, starting in 2002 before decreasing. The average since 1985 to educate a child is $16,738. The cost per student in the proposed budget is $3,088 above this average.
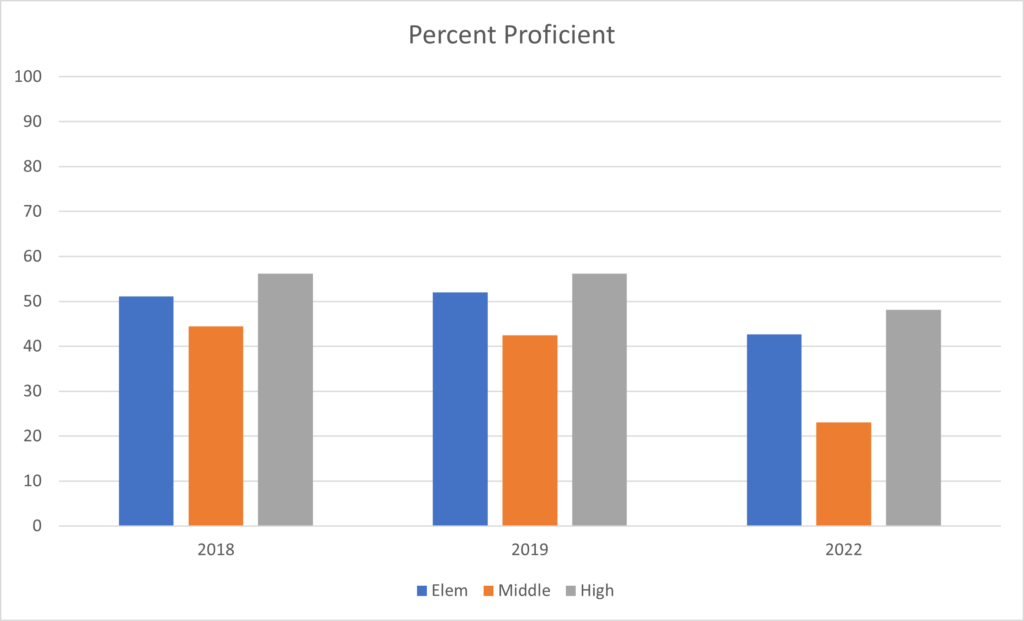
Now the conversation would certainly be worth having if each year since 1985 the results and outcomes accelerated at the same degree that the expense did. But that has been far from the case. Given the lack of historic data, we did look at recently available data. Here are the report card proficiency scores for 2018, 2019, and 2022. Note that they will not release the results for the years of COVID. You will see that at no point over the last 5 years has MCPS achieved a 60% proficiency score!
There is a much more comprehensive review of the lackluster results available at Moderately MoCo. The site does a deep dive into a multitude of testing results and provides easy to understand charts and graphs. It is alarming.
A real conversation needs to be had as it relates to MCPS funding.